- AustraliaEnglish
- BelgiumDutchFrench
- BrasilPortuguese
- BulgariaBulgarian
- CanadaEnglish
- Greater ChinaSimplified ChineseTraditional Chinese
- CzechCzech
- FinlandFinnish
- FranceFrench
- Germany (Global)GermanEnglishFrenchSpanish
- GreeceGreek
- HungaryHungarian
- IndiaEnglish
- ItalyItalian
- IrelandEnglish
- JapanJapanese
- IsraelHebrew
- KoreaKorean
- LuxembourgFrench
- MalaysiaMalaysian
- MexicoSpanish
- Middle East & AfricaEnglish
- NetherlandsDutch
- PolandPolish
- PortugalPortuguese
- RomaniaRomanian
- SlovakiaCzech
- SpainSpanish
- South AmericaSpanish
- South AsiaEnglish
- South East AsiaEnglish
- SwedenSwedish
- ThailandThai
- TurkeyTurkish
- UkraineUkrainian
- United KingdomEnglish
- United States of AmericaEnglish
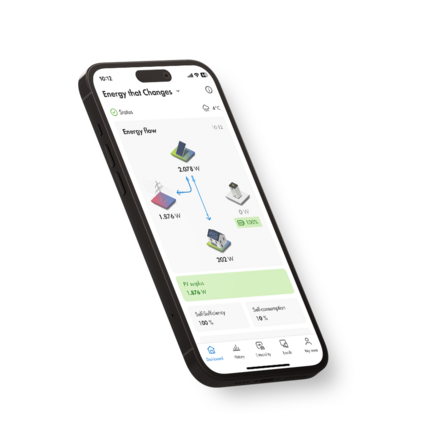
The app for the energy transition at home and on the road
SMA Energy App
Stay up to date with the SMA Energy app
Keep an eye on your Energy System at all times
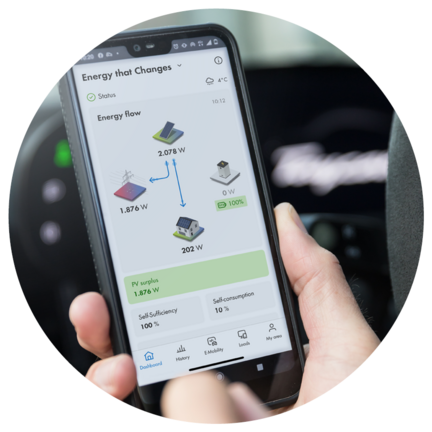
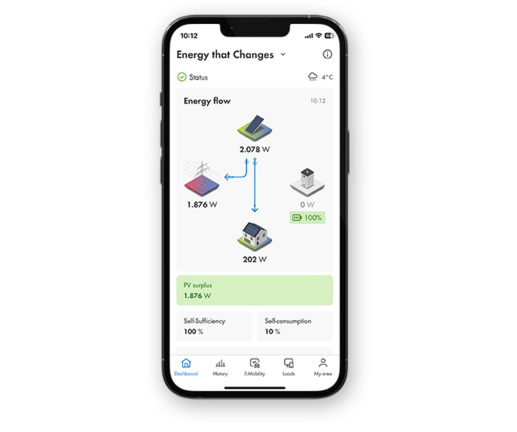
Visualize your energy
Solar power generation and usage, grid-supplied power and battery state of charge.
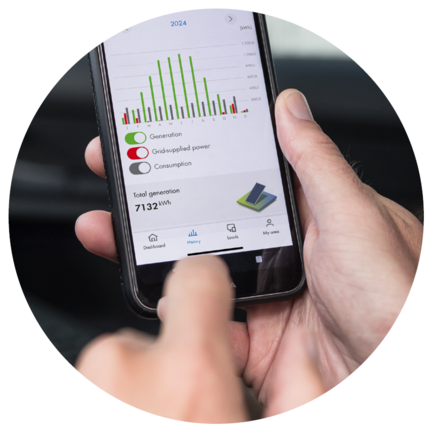
Optimize and manage energy flows
Recommendations for economical energy supply.
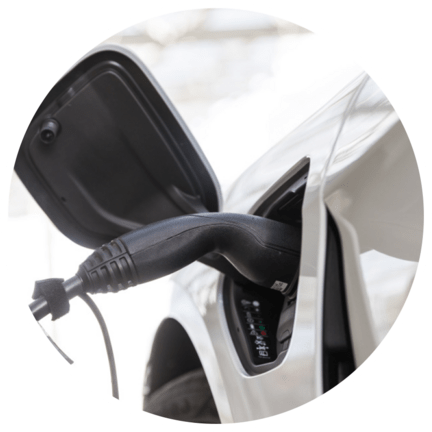
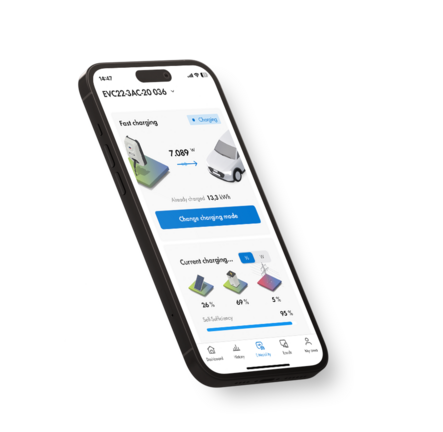
Smart electric vehicle charging
Charging modes for sustainable and affordable or high-speed charging.
Get a better overview
Visualize your energy
View solar power production and usage
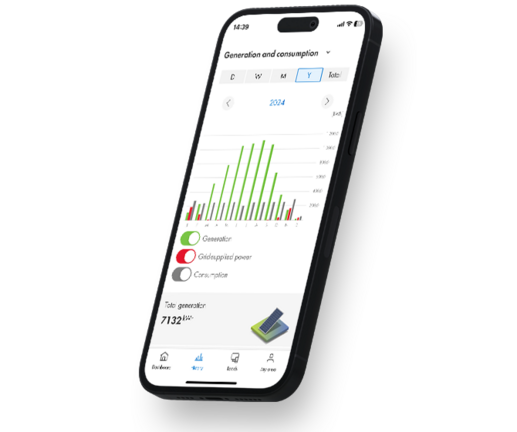
Daily and historical figures
Overview of residual current usage
Display battery state of charge (if available)
View your carbon footprint
Make your energy supply sustainable
View up-to-date forecasts for solar power production
Follow recommended actions for optimized energy use
Reduce grid-supplied power and save on electricity costs
Fill up on sunshine with the SMA EV Charger
Smart electric vehicle charging
Conveniently manage charging processes
Forecast-based charging
Define a charging target and charge at minimal costOptimized charging
Smart charging with self-generated solar powerFast charging
Extra-fast charging via the boost function*
* This function can be enabled only using the rotary switch on the SMA EV Charger.
How you benefit
The app that gives you perspective
Monitor and manage all appliances

Greater independence and protection from rising energy prices

Conserve resources and help further the energy transition
SMA Energy App
FAQ
General
How do I access the SMA Energy App and how do I register?
You will need your Sunny Portal login details for that. You can find a detailed explanation regarding installation and registration in the Sunny Blog.
How will the app benefit me?
The app allows you to keep constant track of your energy system. It clearly visualizes the data for your PV system (yield, grid-supplied power, grid feed-in). It also provides you with a forecast for the next few days and allows you to view your previous yields without any restrictions. If you have appliances, an electric vehicle or a battery in your system, you can also monitor and manage them very easily in the app
How is the app structured?
You enter the app via the Dashboard, where you can switch between the Overview, History and Forecast views. If an EV Charger is configured, the E-mobility tab will also appear next to the Dashboard, as will Loads if loads are configured. German-speaking customers also have the More energy area at their disposal. Here you can find general news about SMA and renewable energies as well as information about our current products and services. The Settings tab rounds off the structure and contains all the functions that allow you to customize the app.
Is there a tablet and/or desktop version of the app?
The Energy App is available as a tablet version both on iOS and on Android.
The web application for visualizing the PV system is the Sunny Portal.
How can I save my login details?
You can save your login details either in the process of logging in or in the app under “Settings” à “General information” à “Save your login credentials”].
Can I also log in with my biometric data (e.g., fingerprint, Face ID) instead of my password?
Yes. To do so, you have to open the app’s settings and ensure that “Save your login credentials” is activated. Then you can allow biometric data to be used for logging into the Energy App in the settings of your smartphone.
Why do I have to log in to the app again after a while even though I saved my login details?
You may be logged out of the app for security reasons from time to time. However, this new login using your password or biometric data should take place without any problems.
Data
What exactly happens with my data?
We store all system data on servers in Germany and make it available to the users with rights to the respective system both via the Sunny Portal and through the Energy App. The current data protection declaration in each case is stored in the settings for the Energy App.
Why might I sometimes have to wait for my data to load in the app?
Each time you open the app, it prompts our backend to access the Sunny Home Manager and retrieve the data for your system. Depending on the volume involved, this may therefore result in a brief wait. We work continuously to bring about data performance improvements.
What can I do if my data is suddenly no longer displayed in the app?
If you have a Home Manager installed, the red flashing LEDs on the device will tell you that there is an error in the system. Furthermore, you should always ensure a stable internet connection. You can find more detailed information on possible errors and their causes in the Sunny Portal.
Why are my data displays temporarily incomplete?
Depending on the data concerned (e.g., forecast or historical data), the app will initiate various retrievals from different backend systems that may have different response times.
Does my data update continuously on its own or do I have to refresh it myself?
In general, the live data should continuously update automatically. If you have the feeling that the data is not current or has frozen, you can pull down the screen to bring about a manual update.
Definitions
PV generation
This value shows you the power currently being generated by your PV system.
PV surplus / PV deficit
The PV surplus or PV deficit is calculated by subtracting the power you consume yourself from the total power you produce with your PV system.
Consumption (total consumption)
The consumption is the power that your household currently obtains from your PV system, the utility grid and the battery. The colors show you what percentage of the total consumption is currently made up of grid-supplied power, direct consumption (PV system) and battery discharge.
Self-consumption
Self-consumption describes the consumption of self-generated energy.
Grid-supplied power
This is the power that your household is currently drawing from the utility grid.
Grid feed-in
Grid feed-in indicates the power that your PV system is currently feeding in to the utility grid. If your PV system is producing more power than your household needs at the moment or can be stored in the battery, the surplus power is fed into the utility grid.
Battery charging
This shows you the power from your PV system that is currently being used to charge the battery.
Battery discharge
This is the power that your household is currently drawing from the battery.
Battery state of charge
This provides you with information on the current state of charge of the battery as a percentage in relation to the battery capacity.
Self-sufficiency quota
The self-sufficiency quota gives the current ratio of energy self-sufficiency to total consumption. Here, energy self-sufficiency represents the power that your household is drawing directly from your PV system (direct consumption) and the battery (battery discharge).
Self-consumption quota
This quota shows the current ratio of self-consumption to PV generation. Here, the self-consumption represents the power that your household is drawing directly from your PV system (direct consumption) and the power that your PV system is storing in the battery (battery charging).
Savings
You can calculate how much you save by using self-produced photovoltaic power with the formula
((direct consumption + battery discharge) x power purchase price) + (grid feed-in x feed-in tariff).
Dashboard
How can I change the scaling on the diagrams in order to see the chosen time period at a glance?
As soon as you rotate your phone into the landscape format, you will see the relevant diagram for that page with the full scaling for the desired period of time. Ensure that your phone allows your screen to rotate (i.e., no orientation locks are activated).
Can I view data for my individual appliances in the diagram (History/Overview)?
At the moment you can only display your total consumption in the Energy App. For a detailed display of your individual appliances, you can log into the Sunny Portal and view it there. We are currently working on making this view available in the app too.
How can I set the data that I want displayed in the Dashboard History?
The view under History can be altered by tapping the small arrow next to “Generation” and “Consumption”. There you can find detailed analyses for generation and consumption. Directly below, you can also set the view to day, week, month, year or the entire period since the system was commissioned.
What does the exclamation point next to the status in my overview mean?
If you see an exclamation point next to the status, your system has an error. If the problem has not resolved itself after some time, please contact your installer. We are currently working on having the type of error indicated along with the error message in future.
How is my forecast data calculated?
The Energy App draws on location-specific weather forecast data and uses it as the basis in calculating the forecast data for you. The orientation of the modules that you have configured in the Sunny Portal is also taken into account.
E-Mobility
What are the various charging modes?
For one thing, there is the “Charging with PV surplus” option.
You can also specify either a charging time (e.g., 2:00 p.m. – 4:00 p.m.) or a charging target (kWh or range) using “Charging with specified target”.
Another option is the “Fast mode”, however this is not set via the app but rather using a switch on the EV Charger itself.
Can I add multiple EV Chargers?
Up to three SMA EV Chargers can be added. These must also be configured via the Sunny Portal.
What can I do if an error message is shown in my E-mobility overview (e.g., communication error)?
First of all, you can try to quit the app completely and open it again. If an error message still appears, please visit the SMA Online Service Center.
Loads
How can I switch my loads on and off?
Once the loads have been configured in the Sunny Portal, they will be displayed on the “Loads” tab. Now load control can be carried out there.
Why can’t some loads be switched on (controlled and uncontrolled loads)?
Controlled loads must be configured in the Sunny Portal via a radio-controlled socket. Uncontrolled loads that are configured via SEM or EEBUS are automatically controlled by the Sunny Home Manager as if they were configured in the Sunny Portal
Settings
Which devices can be added via the QR code quick access?
The inverters that have a QR code on their covers are able to display the inverter’s web interface via the Energy App
Where can I set my individual data (electricity rates, feed-in tariff or information about my electric vehicle, such as its energy consumption)?
You can change all of these details in the app’s settings. You can enter your electricity rates and feed-in tariff in the format 0.0000€/kWh. Your vehicle’s energy consumption requires the format 1.0000kWh/100km.

